


Longitudinal Analysis
In the dynamic world of education and skill development, understanding the long-term impact of programs is crucial. This article explores the power of longitudinal analysis, particularly when enhanced by advanced automated and AI-driven tools like Sopact Sense. We'll delve into how organizations like Girls Code can leverage these techniques to gain deeper insights into their programs' effectiveness and drive meaningful, lasting change.
The purpose of this article is to demystify longitudinal analysis, explain its techniques, and demonstrate its practical application using real-world examples from Girls Code, an organization dedicated to bridging the gender gap in STEM education. By the end, readers will understand how Sopact Sense's advanced automation and AI capabilities can transform months of data analysis into minutes, providing actionable insights to improve programs and communicate impact more effectively.
Longitudinal Data Analysis
Longitudinal data analysis is a research method that involves repeated observations of the same variables over extended periods. In the context of education and skill development programs, it allows organizations to track changes in participant outcomes, attitudes, and behaviors across different stages of a program or intervention.
Why Longitudinal Data Analysis Matters
- Tracks Long-Term Impact: Unlike cross-sectional studies that provide a single point-in-time snapshot, longitudinal analysis reveals how program effects evolve over time.
- Identifies Trends and Patterns: By collecting data at multiple time points, organizations can detect trends and patterns that may not be apparent in short-term assessments.
- Informs Program Improvements: Understanding how outcomes change over time helps organizations refine their programs for maximum effectiveness.
- Strengthens Impact Reporting: Demonstrating sustained impact through longitudinal data can significantly enhance funding applications and stakeholder reports.
- Captures Unexpected Outcomes: Long-term tracking can reveal unforeseen benefits or challenges, providing a more comprehensive view of a program's impact.
Longitudinal Data Analysis Techniques
Sopact Sense employs several advanced techniques to analyze longitudinal data efficiently and effectively. Here are some key approaches:
- Trend Analysis
- Cohort Analysis
- Time Series Analysis
- Growth Curve Modeling
- Repeated Measures Analysis
Longitudinal Analysis Example: Girls Code
Let's walk through a step-by-step example of how Girls Code uses Sopact Sense to conduct a comprehensive longitudinal analysis of their program's impact.
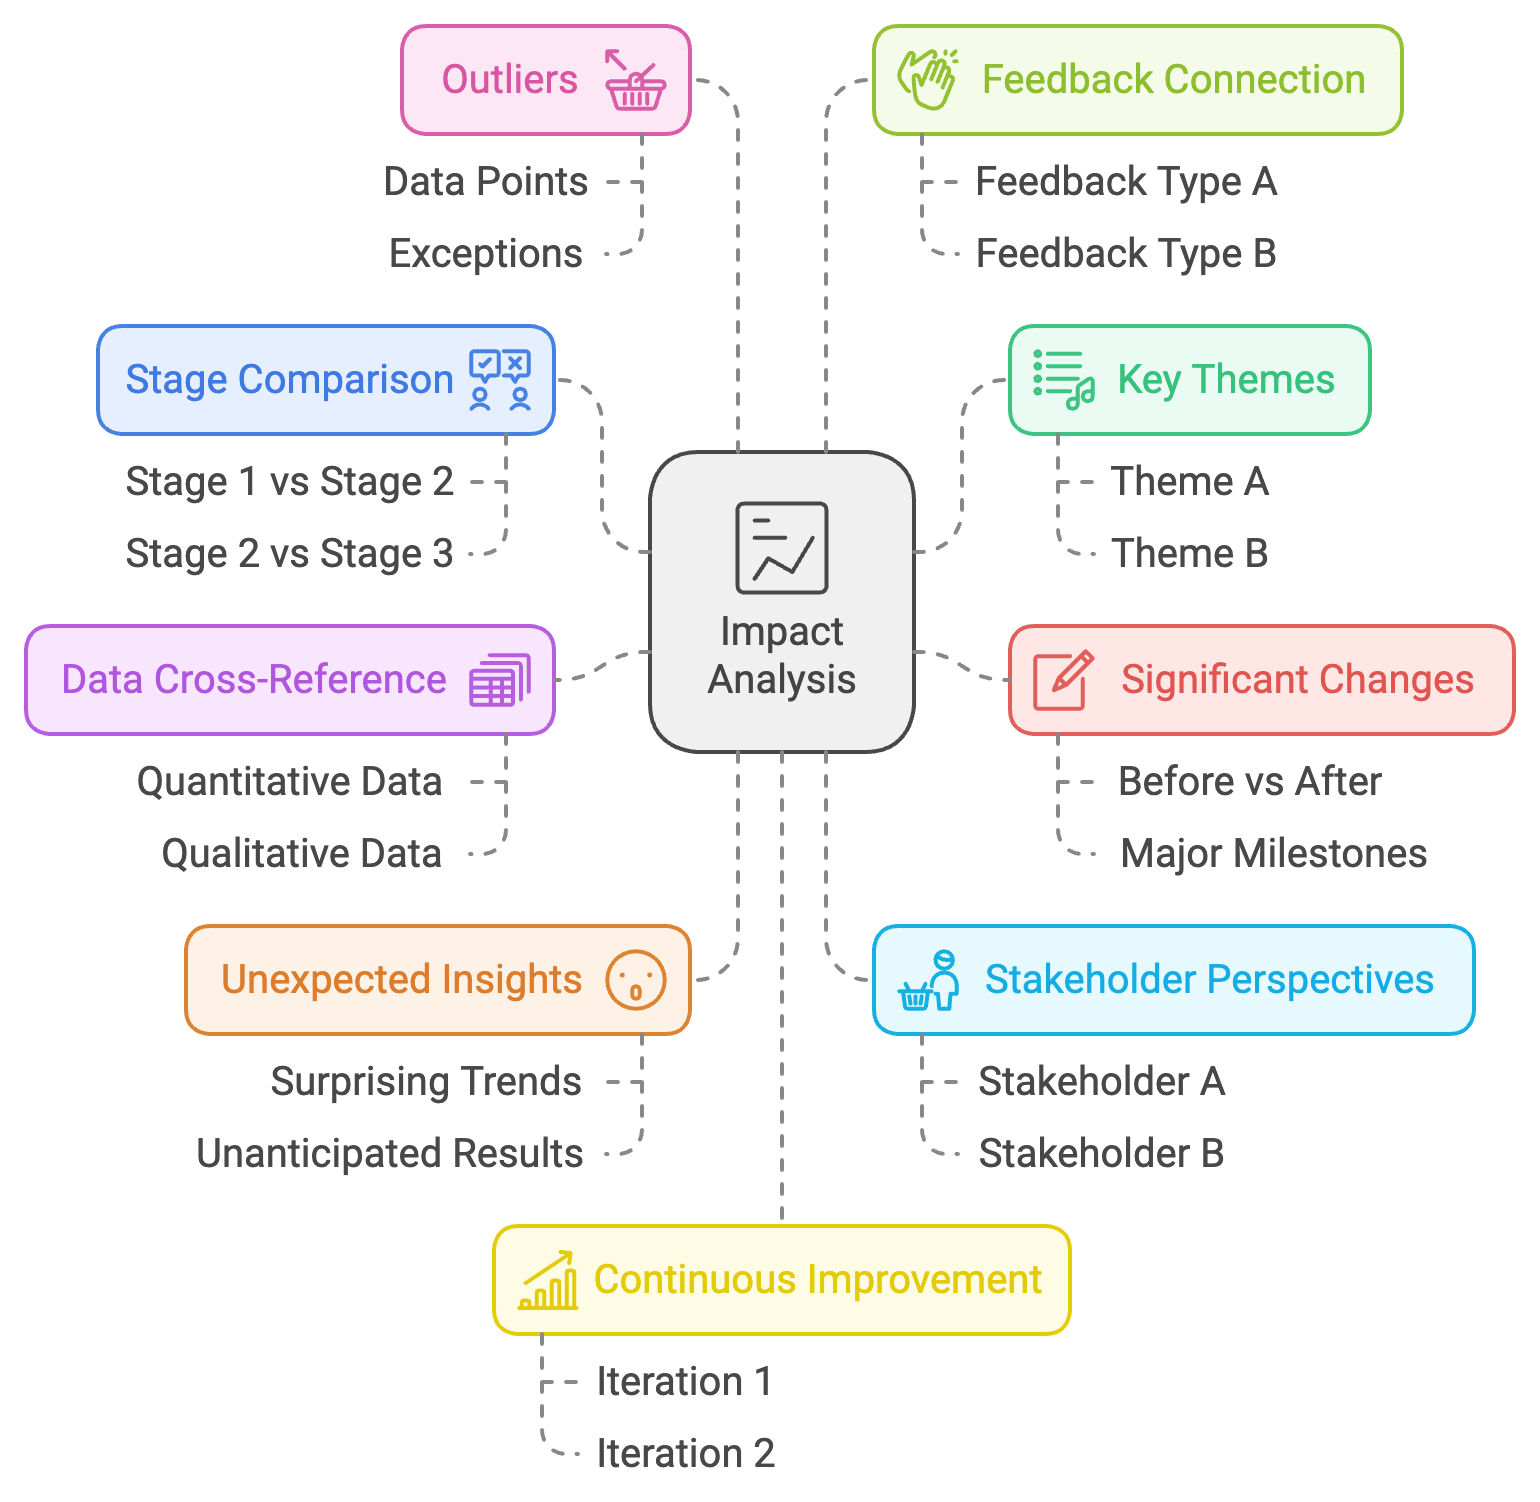
Here’s a concise list of the 12 tips for effective longitudinal analysis:
- Focus on Metrics that Matter
- Demonstrate Causality
- Utilize Stage Comparison
- Analyze Key Themes Across Stages
- Highlight Significant Changes
- Cross-Reference Quantitative and Qualitative Data
- Seek Unexpected Insights
- Understand Stakeholder Perspectives
- Explore the Outliers
- Connect Feedback to Outcomes
- Leverage Follow-up Data
- Use Data to Inform Continuous Improvement
Tip 1: Focus on Metrics that Matter
Prioritizing metrics that reflect the most meaningful outcomes for your key stakeholders is essential. While aligning with funder-required metrics (often output-focused) is common, the most impactful metrics are those that demonstrate true outcomes for stakeholders.
With Sopact Sense, you can streamline this process for deeper insights.
Example: Girls Code refined their metrics using Sopact Sense:
- Initial Metric: "Number of girls trained"
- Enhanced Metrics:
- Percentage of participants confident in coding (tracked over time)
- Pre and post-program average coding test scores
- Percentage of participants who built web applications (including complexity)
Sopact Sense’s integrated survey and analytics tools make collecting and analyzing these metrics faster and more efficient, providing instant insights.
Tip 2: Demonstrate Causality
With Sopact Sense, you can clearly connect inputs, outputs, and outcomes, making it easier to demonstrate causality and the real impact of your efforts.
Example: Girls Code used Sopact Sense to visualize their impact journey:
- Inputs → Outputs → Outcomes → Impact
- Coding workshops → 500 girls trained → Increased coding skills and confidence → More women entering tech careers
Sopact Sense’s impact analytics feature automatically generates these journey maps, enabling organizations to continuously update and refine their theory of change with real-time data.
Tip 3: Utilize Stage Comparison
Sopact Sense automatically processes survey responses to the question: "How confident do you feel about your current coding skills and why?"
Pre-program results:
- No confidence: 70%
- Lack of experience: 56%
- Perceived complexity: 53%
Post-program results:
- No confidence: 23%
- Lack of experience: 53%
- Perceived complexity: 20%
Sopact Sense's AI-driven analysis highlights the significant decrease in "No confidence" responses and the reduction in "Perceived complexity" as key indicators of the program's positive impact on participant confidence.
Tip 4: Analyze Key Themes Across Stages
Sopact Sense processes responses to "Can you give us feedback on the resume building workshop and the impact it had on your job search and interview calls?"
Post-program:
- Improvement in Job Interviews: 36%
- Positive Feedback: 40%
- Resume Enhancement: 23%
Follow-up:
- Improvement in Job Interviews: 10%
- Positive Feedback: 26%
- Resume Enhancement: 10%
The AI-driven analysis highlights the initial positive impact of the resume workshop but also flags the decrease in reported benefits at the follow-up stage, suggesting a need for ongoing support or refresher sessions.
Tip 5: Highlight Significant Changes
Analyzing coding test scores:
- Pre-program average: 52.77
- Post-program average: 71.87
Sopact Sense automatically calculates the percentage improvement and generates visualizations to illustrate this progress over time.
To effectively tell the story behind these results, focus on showcasing the transformation. Highlight key metrics before and after the intervention to clearly illustrate the impact. This simple approach allows stakeholders to see the tangible outcomes of your efforts.
Tip 6: Cross-Reference Quantitative and Qualitative Data
Sopact Sense processes responses to "Did you build a web application?"
Pre-program:
- Yes: 30%
- No: 70%
Post-program:
- Yes: 73%
- No: 26%
The AI-driven analysis flags this significant increase in practical skill application as a strong indicator of program effectiveness.
Tip 7: Seek Unexpected Insights
Sopact Sense's analysis reveals that while "No interview calls" decreased from 16% to 3%, it didn't disappear entirely, suggesting that some participants continue to face challenges. This insight can guide future program refinements.
Tip 8: Understand Stakeholder Perspectives
Tracking responses to "On a scale of 0 to 10, how likely are you to recommend this program to a family member or a friend?"
Post-program average: 8.77Follow-up average: 8.90
The AI analysis notes the consistently high recommendation scores as a strong indicator of sustained program satisfaction.
Tip 9: Explore the Outliers
Sopact Sense identifies that 6% of participants reported "Consistency Issues" in the post-program stage. While a small percentage, addressing this could significantly enhance overall program effectiveness.
Tip 10: Connect Feedback to Outcomes
The analysis links positive feedback about the resume workshop to tangible outcomes: 33% of participants reported multiple interview calls post-program.
Tip 11: Leverage Follow-up Data
Sopact Sense's longitudinal analysis shows that 20% of participants still reported a "Boost in Confidence" at the follow-up stage, indicating lasting benefits of the program.
Tip 12: Use Data to Inform Continuous Improvement
Despite overall gains, Sopact Sense identifies that 20% still reported "No confidence" in the Post stage, suggesting a need for additional resources or targeted interventions.
Conclusion
Longitudinal analysis, powered by advanced tools like Sopact Sense, offers organizations like Girls Code unprecedented insights into their program's long-term impact. By automating data processing and employing AI-driven analysis, Sopact Sense transforms what was once a months-long endeavor into a matter of minutes, providing organizations with timely, actionable insights.
This approach not only enhances program effectiveness but also equips organizations with compelling, evidence-based narratives to share with stakeholders and funders. As the education and skill development sector continues to evolve, embracing these advanced analytical techniques will be crucial for organizations seeking to maximize their impact and secure sustainable support for their missions.
FAQs
What are the benefits of longitudinal data analysis in early childhood improvement and youth transition programs?
Longitudinal data analysis helps track individual progress, identify successful interventions, and evaluate long-term outcomes in early childhood improvement and youth transition programs. It provides insights into the factors contributing to positive development and enables evidence-based decision-making.
How can longitudinal data analysis inform policy and program development in these target segments?
Longitudinal data analysis provides evidence to inform policy and program development by identifying effective strategies, highlighting areas for improvement, and measuring the long-term impact of interventions. It helps organizations allocate resources efficiently and make data-driven decisions.
What are some ethical considerations when collecting and analyzing longitudinal data in these contexts?
Ethical considerations include obtaining informed consent, ensuring participant privacy and confidentiality, and using data that aligns with ethical guidelines. Organizations should also consider potential biases and protect vulnerable populations throughout the data collection and analysis processes.
Can longitudinal data analysis be used to assess the long-term impact of early childhood improvement and youth transition programs?
es, longitudinal data analysis is particularly well-suited to evaluate the long-term impact of interventions in early childhood improvement and youth transition programs. Researchers can examine developmental trajectories and measure outcomes beyond immediate program effects by tracking individuals over an extended period.