

Quantitative Data
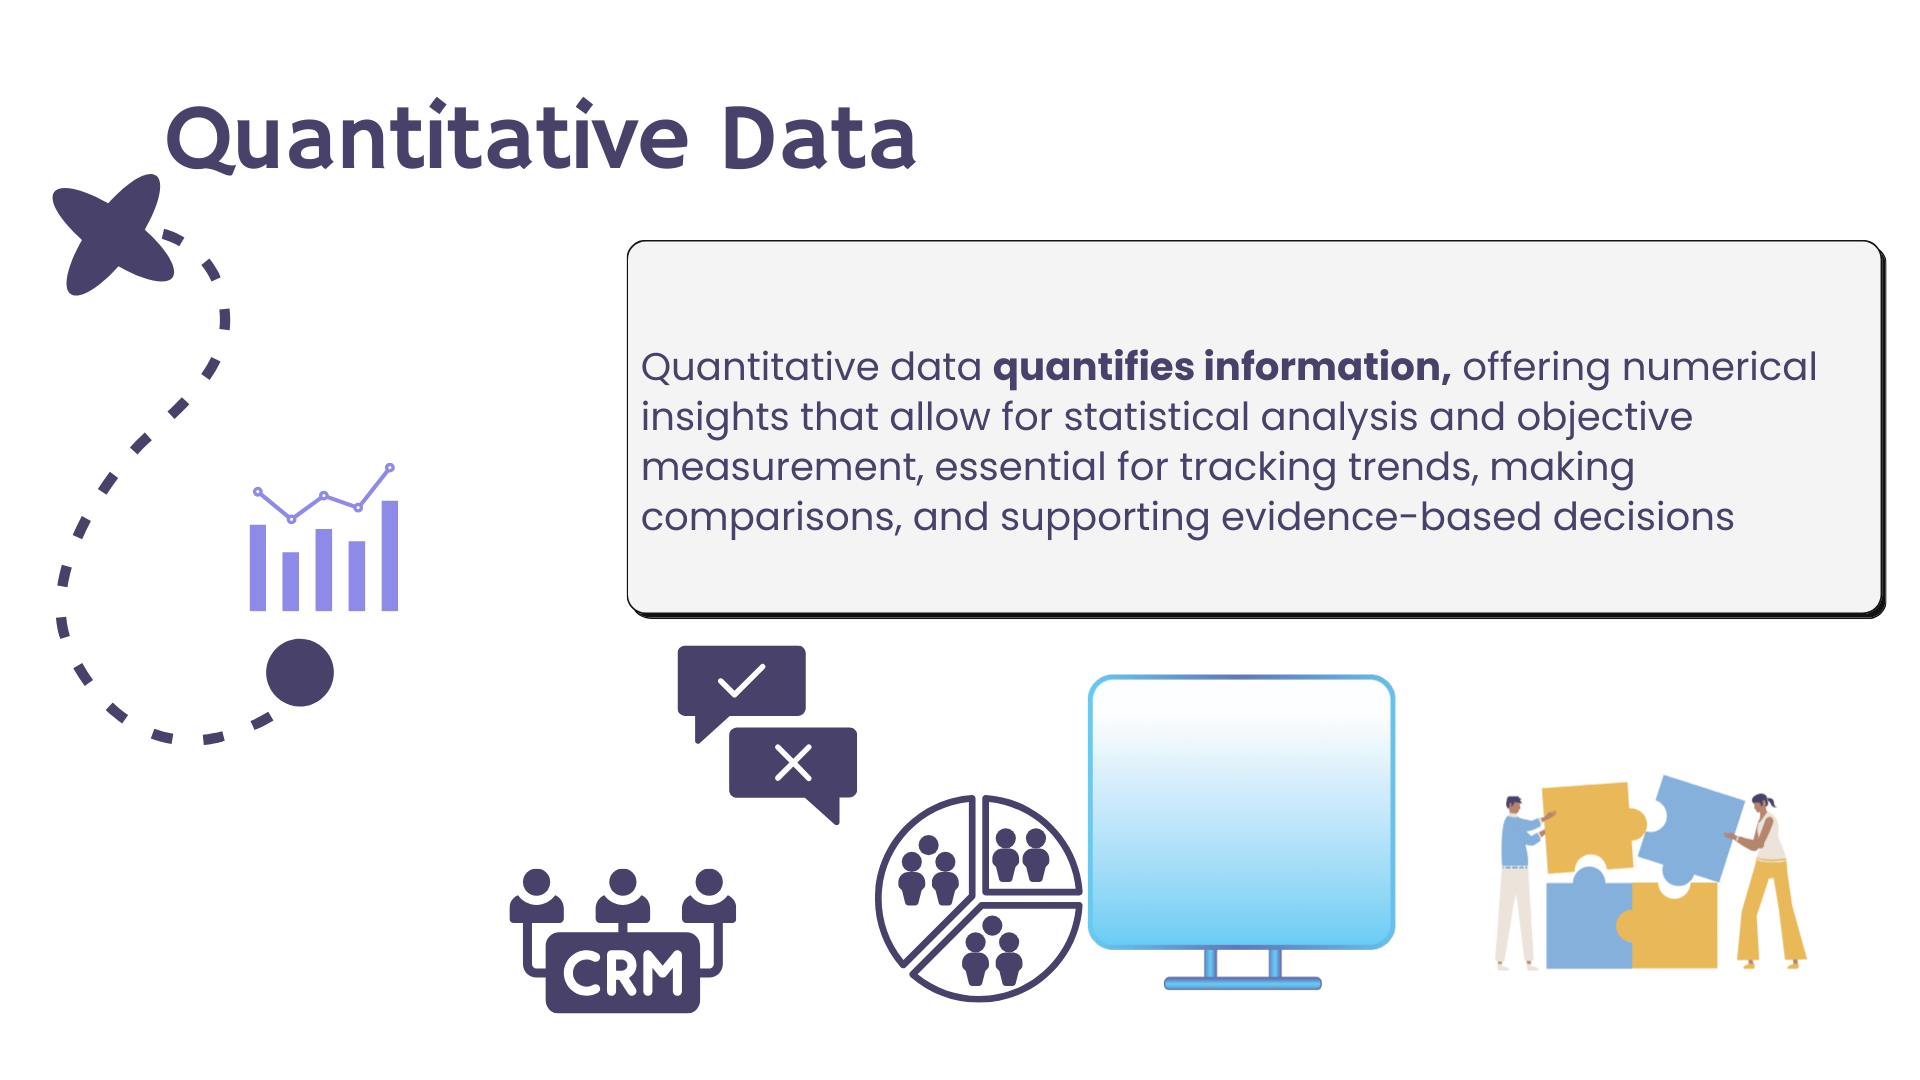
Quantitative data constitutes numerical information fundamental for statistical analysis and informed decision-making across various domains. Derived primarily from structured sources such as closed-ended survey questions or demographic databases like Customer Relationship Management (CRM) systems, it serves as a cornerstone for tracking trends and supporting evidence-based decisions.
In numerous fields, quantitative data holds paramount importance, facilitating precise comparisons and the formulation of evidence-based strategies. Its numerical nature allows for rigorous analysis and interpretation, enabling researchers and decision-makers to draw reliable conclusions.
A key strength of quantitative data lies in its ability to transcend subjective interpretations. By providing clear, quantifiable measures, it mitigates the risk of ambiguity and bias, fostering data-backed decisions grounded in empirical evidence rather than personal perceptions or assumptions.
Moreover, quantitative data excels in its capacity to convert specific information into actionable insights. Whether assessing market trends, evaluating customer behavior, or optimizing operational processes, it empowers organizations to make strategic decisions with confidence and precision.
In today's data-driven world, the role of quantitative data cannot be overstated. Its inherent ability to uncover patterns, identify correlations, and quantify relationships underscores its significance in promoting precision, insight, and informed decision-making across diverse sectors and industries.
Quantitative data encompasses information that can be expressed numerically, measured, and analyzed statistically. This includes data collected through closed-ended surveys, demographic information from databases like CRMs, and other sources yielding numerical values.
In this guide, we explore the power of quantitative data for executives, impact managers, and data professionals involved in training and workforce development. We'll focus on leveraging quantitative data to drive strategic decisions and improve program outcomes.
By distilling observations into clear, measurable insights, quantitative data enables us to move beyond subjective opinions, making it a powerful tool for making informed, data-backed decisions.
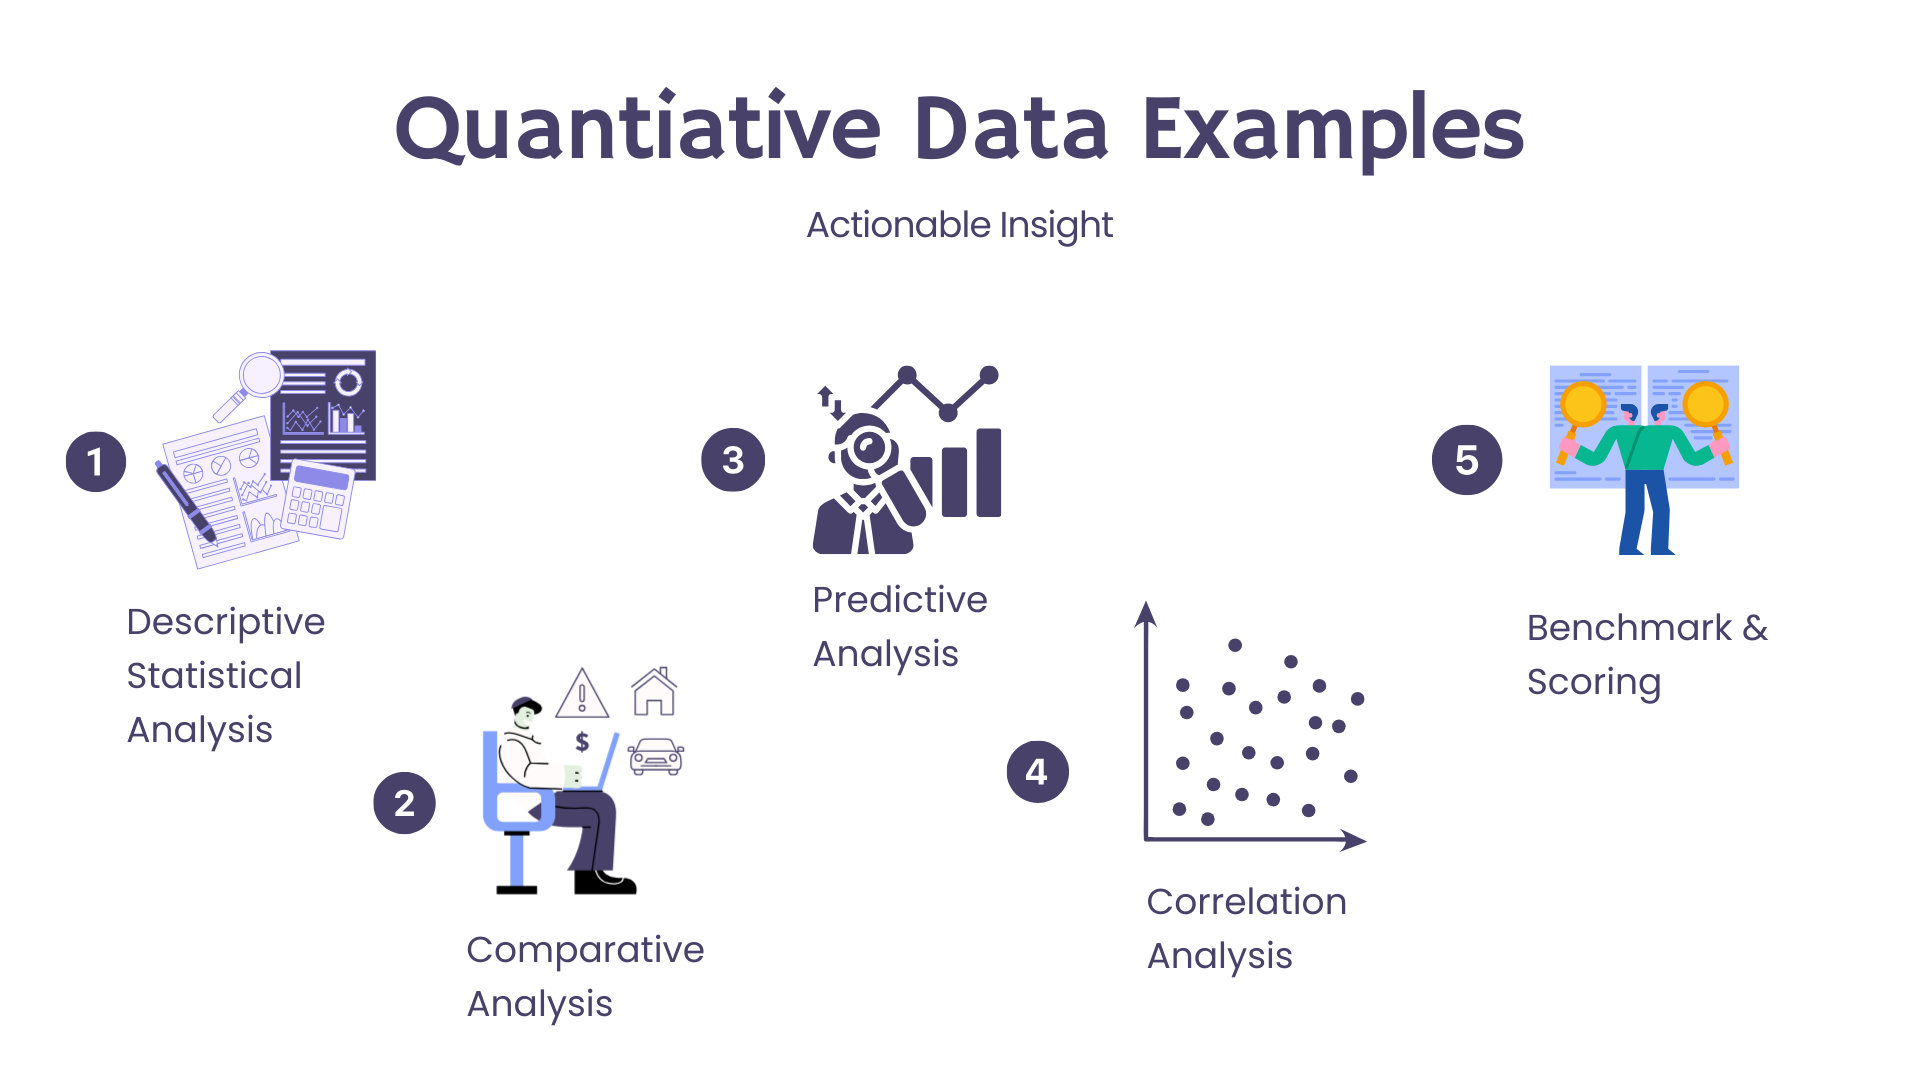
Quantitative Data Examples
Quantitative research methods focus on numerical data and statistical analysis to describe, explain, and predict phenomena. These methods are crucial for testing hypotheses, identifying patterns, and drawing generalizable conclusions. The following visual guide illustrates ten key approaches used in quantitative data collection and analysis. Each method offers unique strengths in measuring, analyzing, and interpreting numerical information, providing researchers with powerful tools to explore relationships, trends, and causalities across various fields of study.
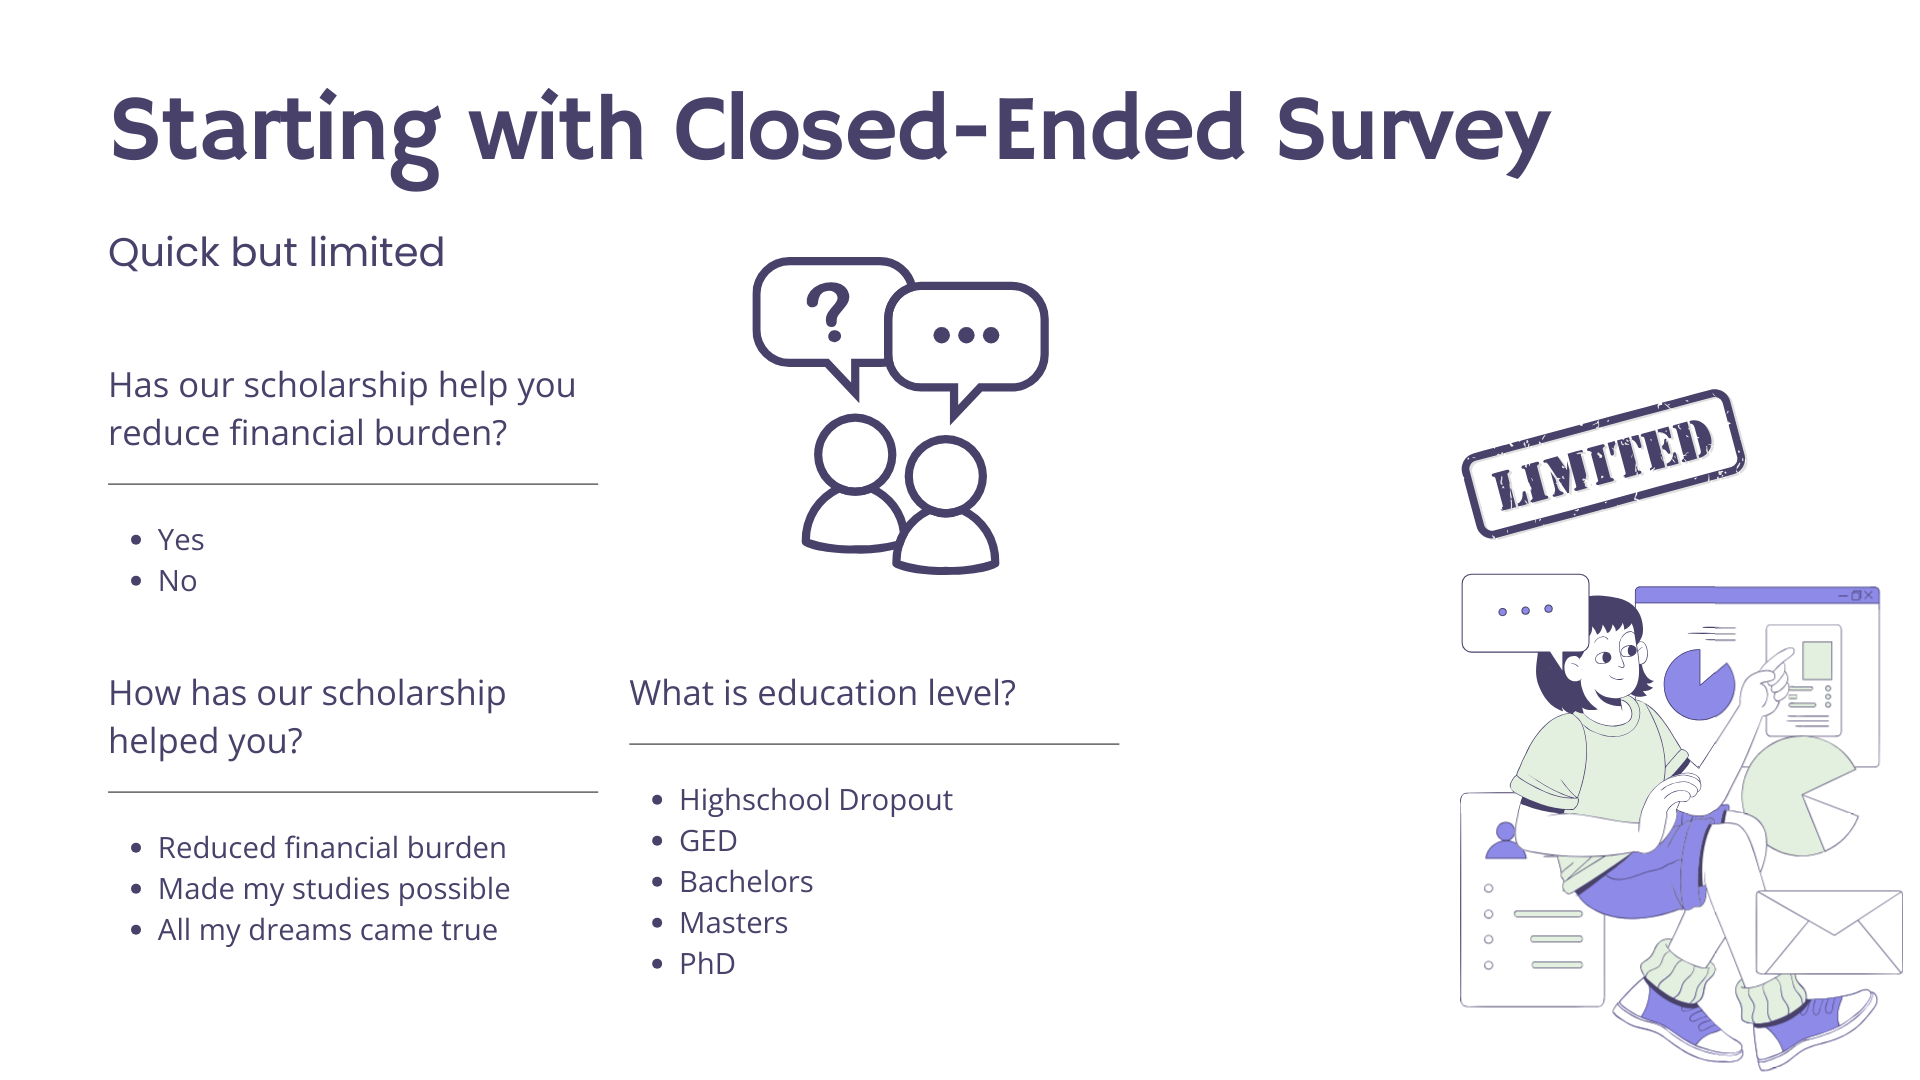
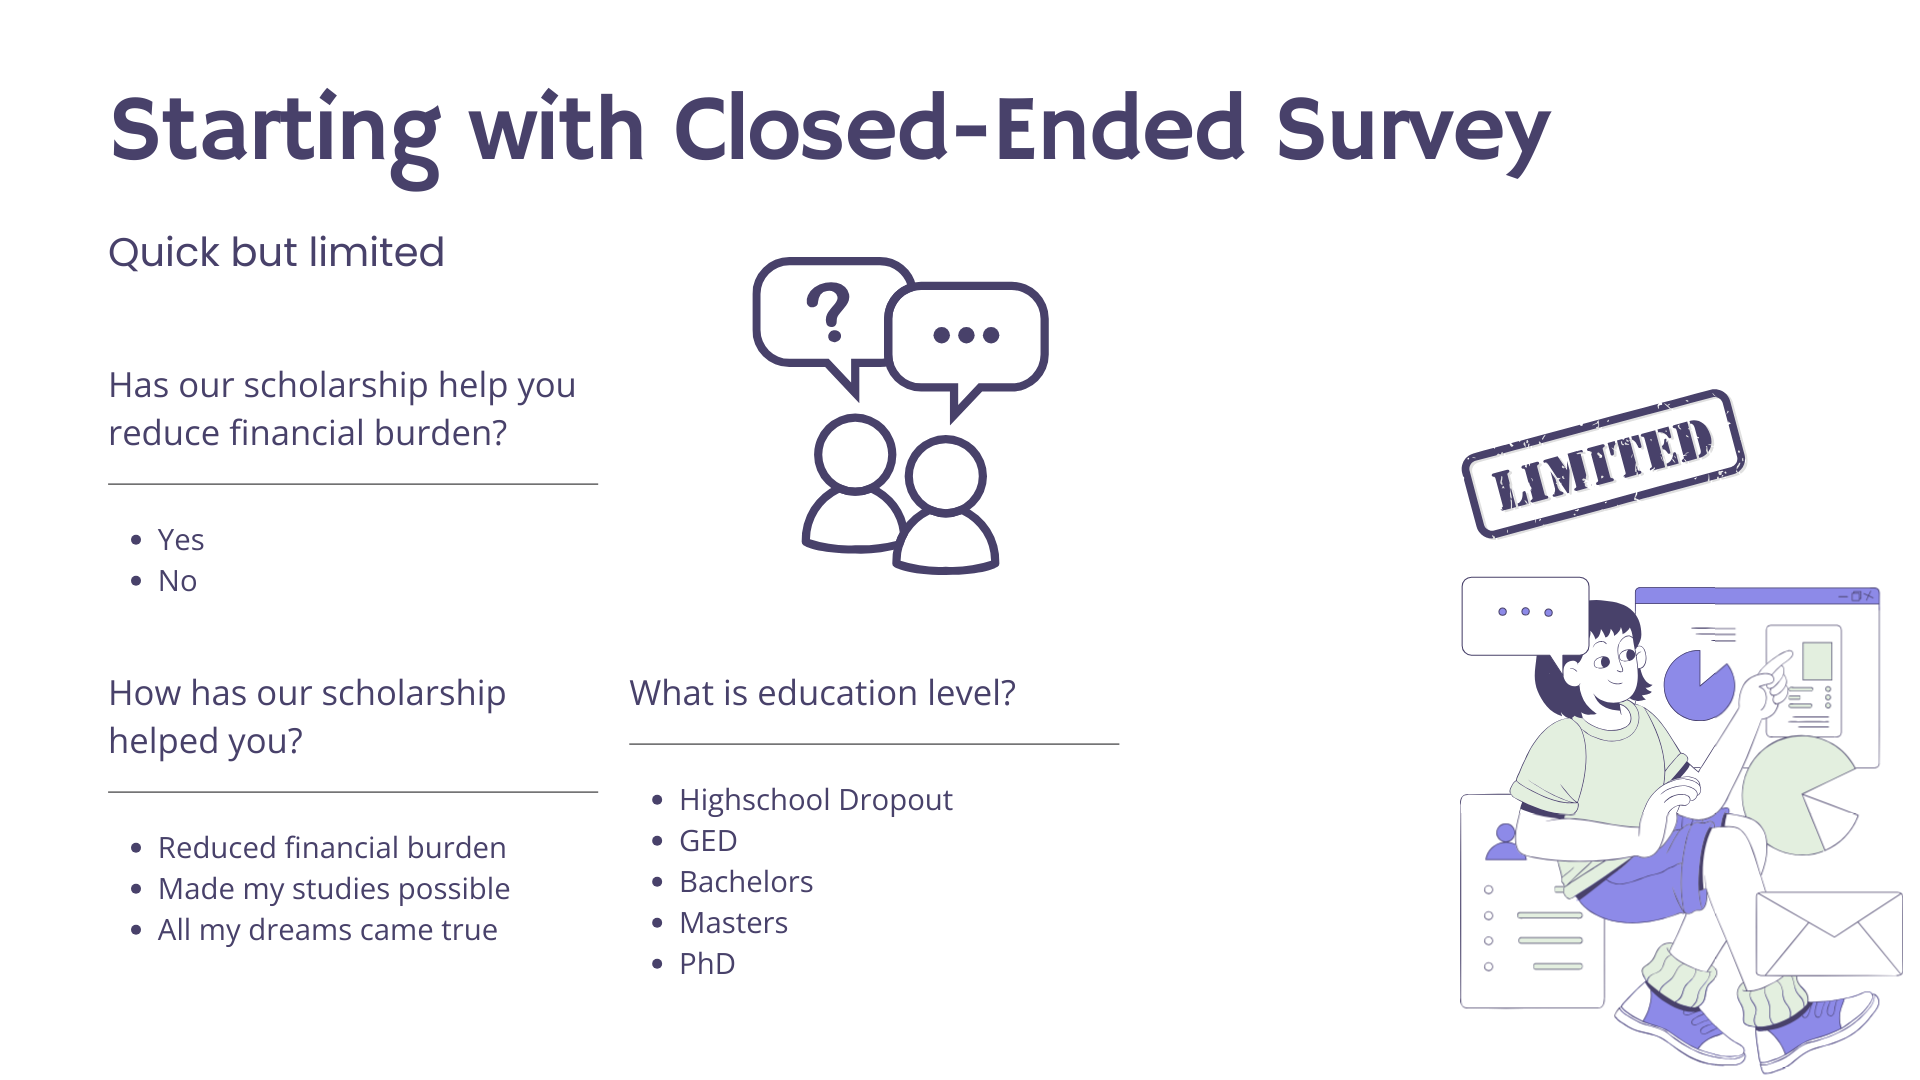
Quantitative Data Collection: Closed Ended Questions
To further enhance the utility of descriptive statistical analysis in training programs, incorporating closed-ended questions on topics like scholarship impacts and education levels can provide valuable quantitative data. This approach, exemplified by Future Up Skill, offers a structured way to collect crucial information. However, it's important to note that while this method excels in quantifying aspects of the participants' experiences, it may not capture the full depth of those experiences. For a more comprehensive understanding, reviewing examples of how training programs have been tailored based on this data can be enlightening. Such examples can showcase the balance between the breadth of quantitative data and the depth of qualitative insights, offering a holistic view of participant needs and experiences.
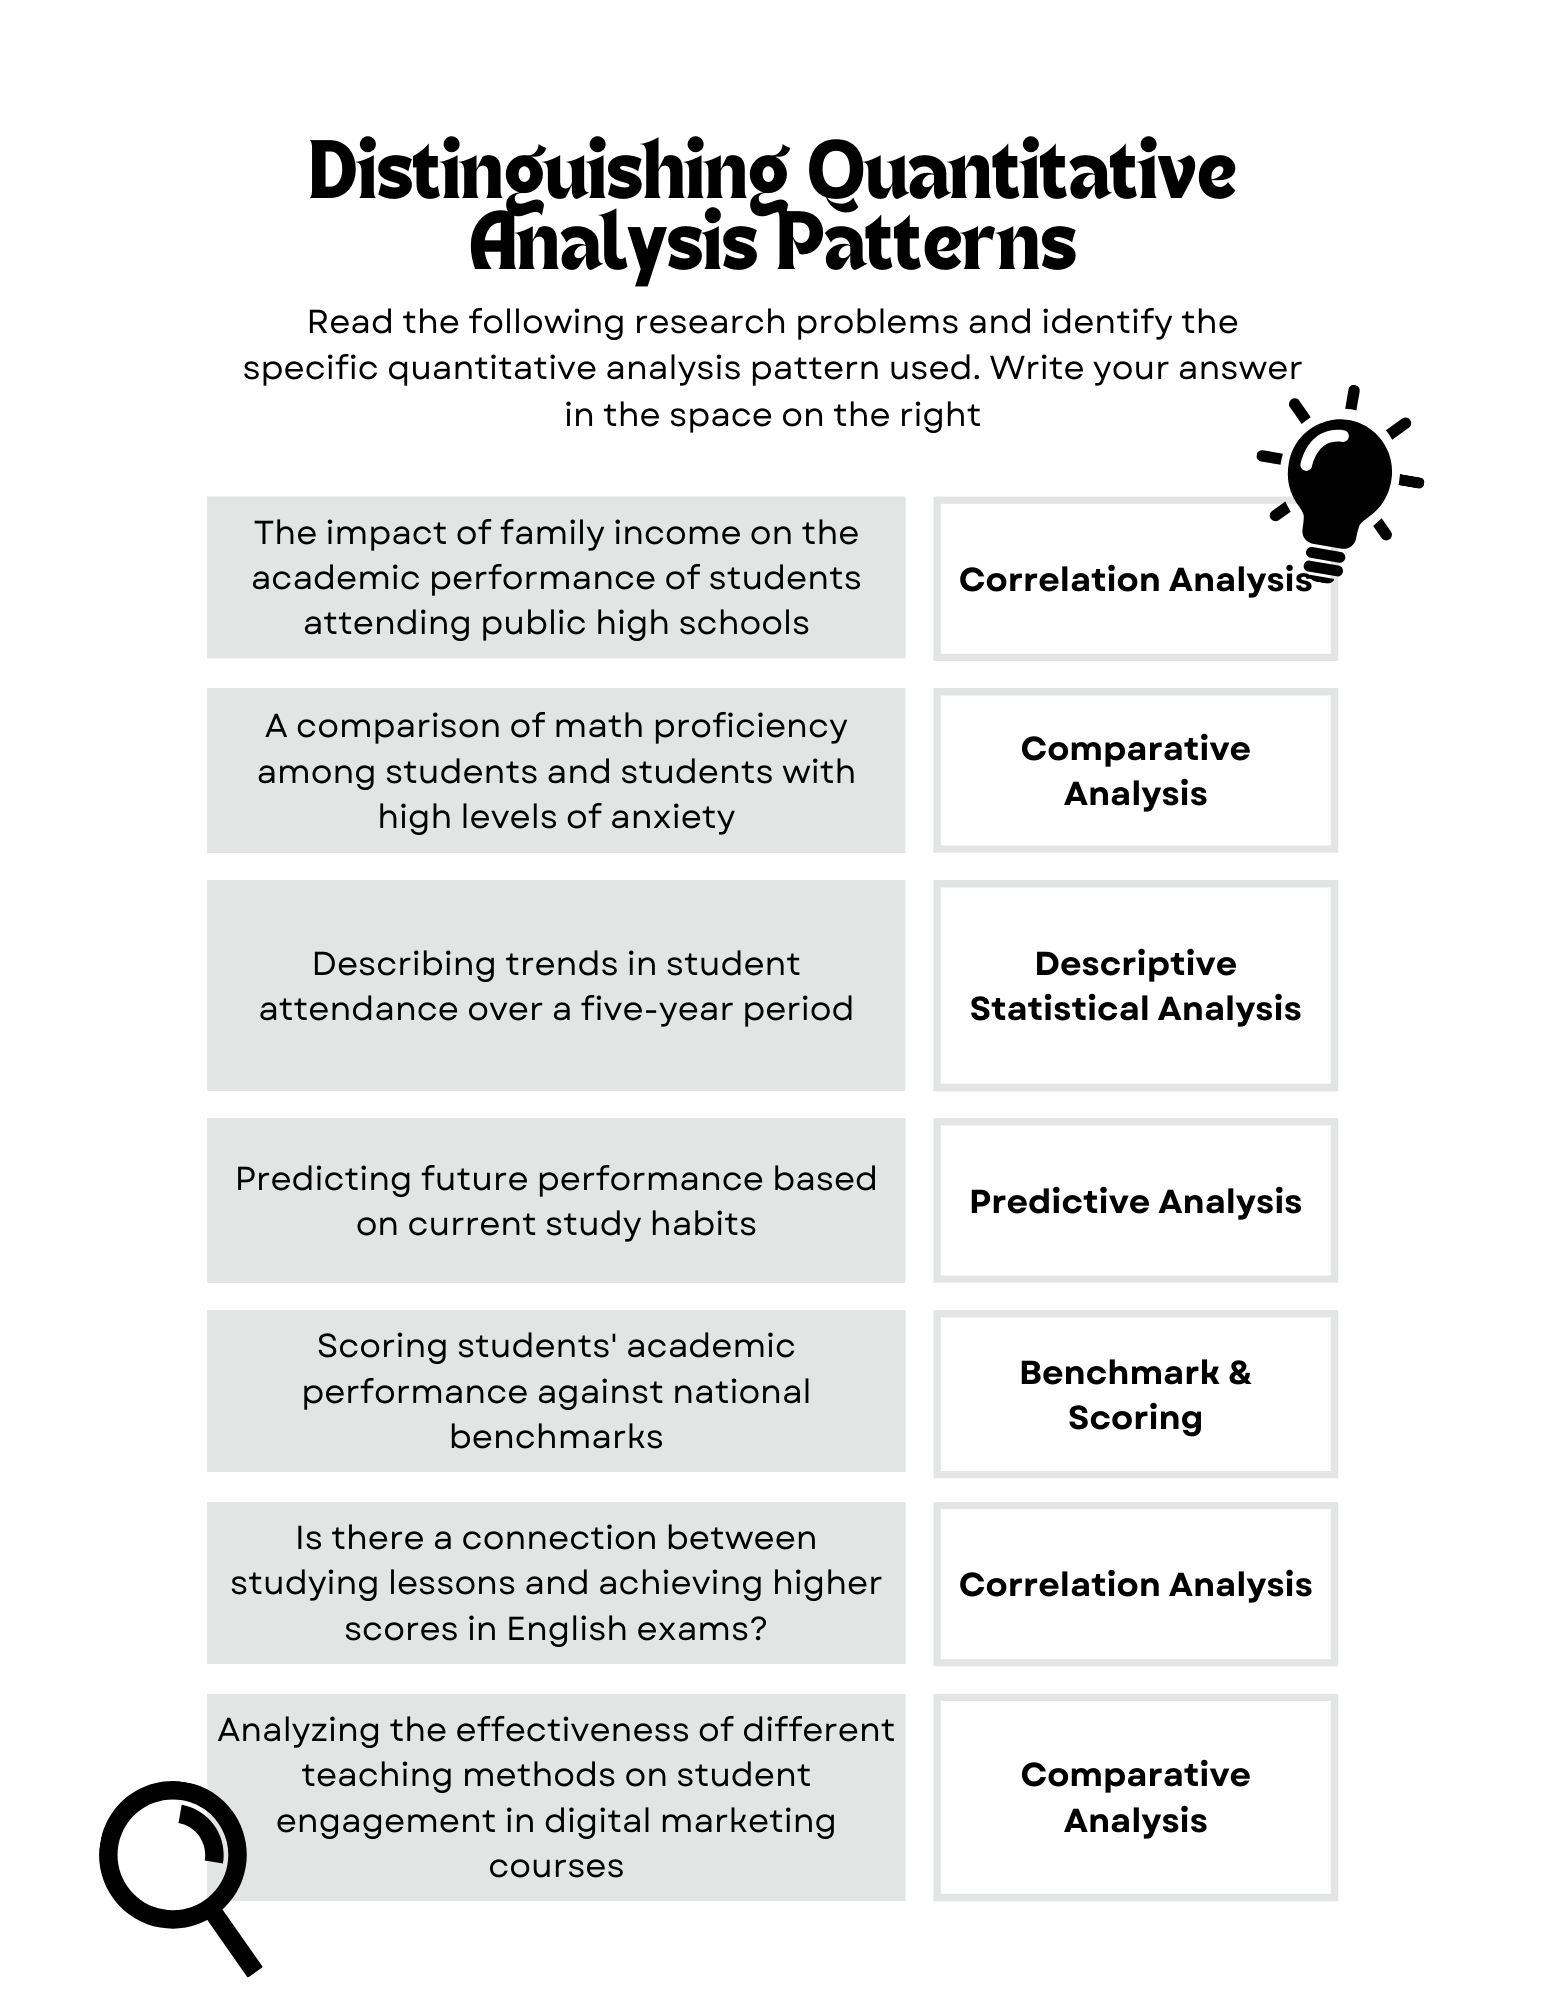
Let's take a short pause to see if you can identify the most appropriate patterns for each research problem. Compare your answers with the key provided at the end of the article.

Quantitative Measurement
Empowering Data-Driven Decision-Making
Quantitative measurement refers to the process of collecting and analyzing numerical data, which is essential for conducting statistical analyses and making informed decisions. This type of measurement often involves utilizing closed-ended questions or collecting demographic information through systems like Customer Relationship Management (CRM) or loan management systems. By providing a numerical foundation, quantitative measurement enables the transformation of complex observations into understandable insights.
The Significance in Modern Decision-Making:
In the realm of modern decision-making, quantitative data is indispensable. It serves as the backbone for statistical analysis, facilitating the tracking of trends and supporting evidence-based decisions. This data type allows for precise comparisons and the formulation of strategies that are firmly rooted in reality. Therefore, quantitative measurement is critical for organizations seeking to navigate the complexities of today's data-driven environment effectively.
Streamlined Four-Step Process:
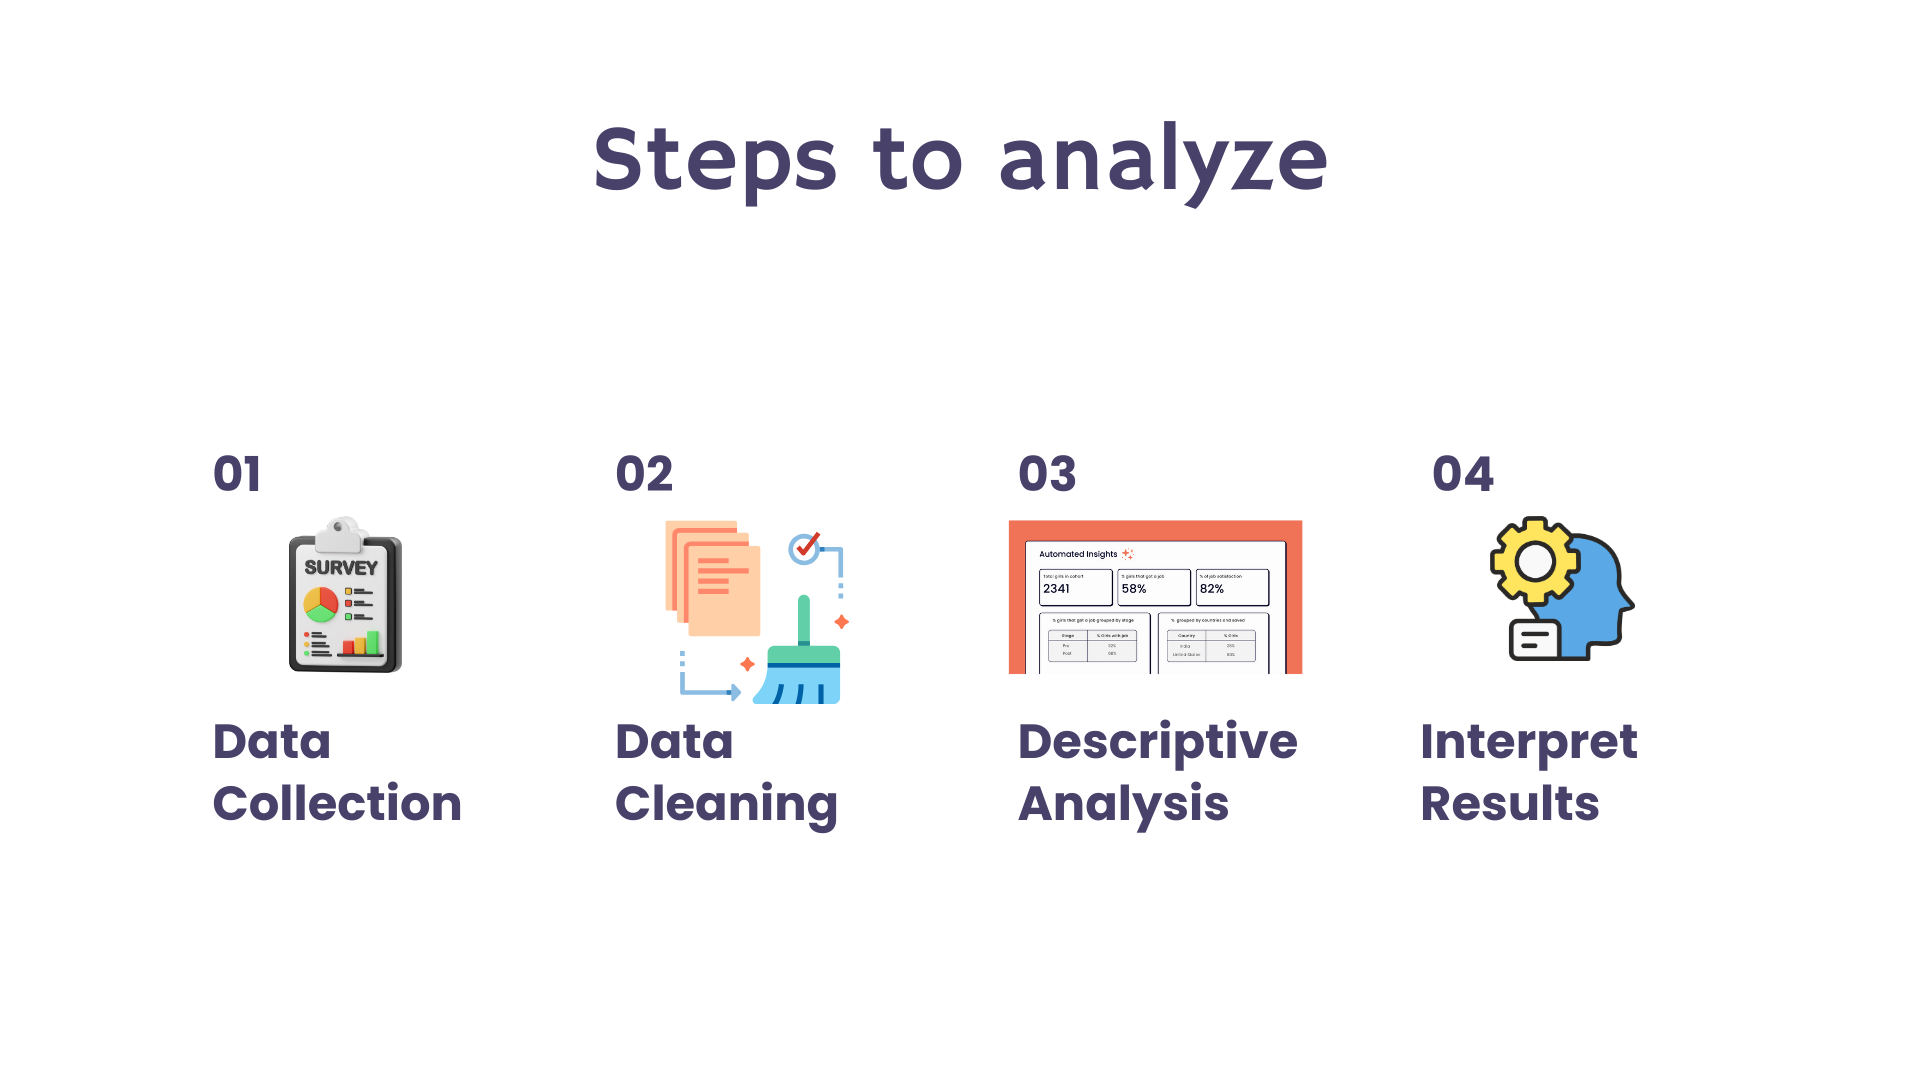
Following our Descriptive Statistical Analysis, let's examine a streamlined four-step process:
Step One: Data CollectionGathering essential data on participant demographics and training outcomes lays the groundwork for insightful analysis. Accurate and comprehensive data collection ensures that the subsequent analysis is based on a solid foundation of information.
Step Two: Data Cleaning with So pact SenseTraditionally, transitioning from a survey to Excel often involves a time-consuming data cleaning process. However, by leveraging So pact Sense integrated with So pact Survey, this step is seamlessly eliminated. The integration ensures that the data collected is already cleaned and ready for analysis, saving valuable time and resources.
Step Three: Descriptive Analysis with So pact SenseUtilizing So pact Sense, experience automated analysis that swiftly summarizes data features. This automated process makes the analysis efficient and insightful, providing program managers with a clear understanding of the data trends and patterns.
Step Four: Interpretation of ResultsWith the automated insights generated by So pact Sense, program managers can make informed decisions on training improvements. By identifying key strategies for skill enhancement, program managers can refine training programs to better meet the evolving needs of their participants.
This efficient methodology empowers program managers to continuously refine training programs, ensuring they remain relevant and effective in addressing the needs of participants. By leveraging automated analysis tools like So pact Sense, program managers can streamline the analysis process and focus their efforts on implementing impactful training strategies.
Quantitative Indicators
Quantitative indicators are essential tools for measuring and assessing various aspects of performance and outcomes across different fields. These indicators rely on numerical data, providing clear, objective metrics that can be analyzed statistically to draw meaningful conclusions. The following sections highlight the importance and application of quantitative indicators in education, STEM programs, and healthcare.
- Education: In the educational realm, quantitative indicators include metrics such as student grades, standardized test scores, graduation rates, and attendance records. These indicators offer a straightforward way to evaluate academic performance, identify trends, and compare outcomes across different groups or over time. For example, tracking standardized test scores helps educators assess the effectiveness of teaching methods and curriculum changes. Graduation rates and attendance records are critical for identifying at-risk students and implementing timely interventions to improve retention and success rates.
- STEM Programs: Quantitative indicators in STEM programs encompass measures such as enrollment numbers, participation rates in STEM activities, test scores in STEM subjects, and the percentage of students pursuing STEM careers. These metrics provide valuable insights into the reach and impact of STEM initiatives. By analyzing enrollment and participation data, program coordinators can identify gaps and opportunities for increasing engagement. Test scores and career pursuit percentages help evaluate the program's effectiveness in fostering interest and competence in STEM fields, guiding future program development and resource allocation.
- Healthcare: In healthcare, quantitative indicators are used to measure patient outcomes, service efficiency, and the overall effectiveness of healthcare interventions. Common indicators include hospital readmission rates, average length of stay, patient satisfaction scores, and the incidence of specific diseases or conditions. These metrics enable healthcare providers to monitor and improve the quality of care, identify areas needing improvement, and allocate resources more effectively. For instance, reducing readmission rates is a key goal, often achieved by analyzing data to understand causes and implementing targeted interventions.
Quantitative indicators are indispensable in providing a clear, measurable understanding of performance and outcomes. They allow for objective analysis, comparison, and benchmarking, forming the foundation for evidence-based decision-making and continuous improvement in various domains. By leveraging these indicators, organizations can better track progress, identify areas for enhancement, and achieve their strategic goals more efficiently.
Quantitative Evaluation
Transforming Data into Actionable Insights
Quantitative evaluation involves the systematic use of quantitative data to assess the performance, effectiveness, or impact of a project, policy, or program. It plays a pivotal role in promoting precision, insight, and informed decision-making across various fields.
Transforming Data into Actionable Insights:
In an era dominated by data, the ability to derive clear, quantifiable measures from quantitative data is invaluable. It eliminates room for subjective interpretations, paving the way for decisions backed by solid data. Through quantitative evaluation, organizations can convert detailed information into actionable strategies, ensuring that decisions are not only informed but also aligned with the overarching goals and realities of the market or field of interest.
Key Distinctions from Quantitative Measurement:
While quantitative measurement focuses on collecting and analyzing numerical data, quantitative evaluation takes a step further. It involves utilizing this data to assess the performance, effectiveness, or impact of a specific project, policy, or program. Quantitative evaluation serves as a means to validate the success or shortcomings of initiatives and inform future decision-making processes.
Importance in Informed Decision-Making:
Quantitative evaluation provides organizations with a structured framework for assessing the outcomes of their endeavors. By transforming raw numerical data into actionable insights, it empowers decision-makers to make informed choices that are grounded in empirical evidence rather than subjective opinions. This approach ensures that resources are allocated efficiently and strategies are tailored to achieve desired objectives.
Driving Strategic Planning:
Moreover, quantitative evaluation guides strategic planning by identifying areas of strength and areas for improvement. By analyzing quantitative data trends and patterns, organizations can adapt their strategies to capitalize on successes and address challenges effectively. This iterative process fosters continuous improvement and ensures that initiatives remain aligned with organizational goals and objectives.
Quantitative evaluation serves as a cornerstone for evidence-based decision-making and strategic planning. By systematically analyzing quantitative data, organizations can gain valuable insights into the performance and impact of their initiatives, driving informed decision-making and fostering continuous improvement. In an increasingly data-driven world, the ability to harness the power of quantitative evaluation is essential for achieving organizational success and driving positive outcomes.
Quantitative Data Collection
While surveys represent a crucial source of data collection, organizations often draw from a variety of sources to gather comprehensive insights. Beyond surveys, data may be sourced from Customer Relationship Management (CRM) systems, activity logs, human resources records, and more. Each source offers unique perspectives, contributing to a holistic understanding of organizational performance and impact.
CRM Systems:CRM systems house valuable demographic and interaction data, providing insights into customer or client relationships, preferences, and engagement levels. By analyzing CRM data, organizations can track customer interactions, measure satisfaction levels, and tailor strategies to enhance customer experiences.
Activity Logs:Activity logs document the actions and interventions undertaken by organizations, offering a detailed record of program activities, outputs, and outcomes. These logs provide insights into the implementation process, allowing organizations to assess program fidelity, monitor progress, and identify areas for improvement.
Human Resources Records:Human resources records capture data related to staff recruitment, training, performance, and retention. Analyzing HR data enables organizations to assess workforce capacity, skill gaps, and organizational culture, informing strategic decisions related to talent management and organizational development.
Differentiation from Surveys:While surveys primarily focus on capturing changes, progress, or timelines, other data sources such as CRM systems, activity logs, and HR records provide information on activities, outputs (in terms of theory of change), and organizational dynamics. These sources offer a more comprehensive view of organizational functioning, complementing survey data by providing context and depth to quantitative analysis.
Integration for Comprehensive Analysis:Integrating data from multiple sources allows organizations to triangulate findings, validate conclusions, and identify patterns that may not be apparent from individual datasets alone. By harnessing the collective insights derived from diverse data sources, organizations can make more informed decisions and drive meaningful impact.
Quantitative data collection extends beyond surveys to encompass a variety of sources, including CRM systems, activity logs, and HR records. Each source offers unique insights into organizational performance and impact, contributing to a comprehensive understanding of program effectiveness and informing evidence-based decision-making. By integrating data from diverse sources, organizations can gain deeper insights, optimize resources, and maximize their impact on target populations.
Quantitative Survey
Designing Effective Data Collection
Quantitative surveys represent a systematic method of collecting data from a large sample size to draw statistically significant conclusions about a population or phenomenon. These surveys utilize structured questionnaires with closed-ended questions, enabling easy quantification and statistical analysis of responses. Widely used across various fields such as market research, social sciences, and healthcare, quantitative surveys offer valuable insights into trends, preferences, behaviors, and attitudes.
Best Practices in Designing Quantitative Surveys:
- Define Clear Objectives:Clearly articulate the research objectives of the survey. Understand what information is needed and how it will be utilized to ensure the survey is focused and relevant.
- Target Population Identification:Define the target population accurately to ensure that the sample represents the population of interest effectively.
- Questionnaire Development:
- Structured Format: Utilize closed-ended questions with predefined response options for easy quantification and analysis.
- Clarity and Simplicity: Formulate clear and concise questions to minimize ambiguity and respondent confusion.
- Avoid Leading Questions: Ensure questions are neutral and unbiased to elicit genuine responses and prevent skewing results.
- Logical Flow: Organize questions logically to maintain respondent engagement and enhance survey completion rates.
- Pilot Testing: Conduct pilot testing with a small group to identify any issues with question wording, response options, or survey flow and make necessary revisions.
- Sampling Strategy:
- Random Sampling: Employ random sampling techniques to ensure every member of the target population has an equal chance of being selected, minimizing selection bias.
- Sample Size Determination: Calculate the required sample size based on the desired level of confidence and margin of error to achieve statistically significant results.
- Sampling Frame: Ensure the sampling frame accurately represents the target population to avoid sampling bias.
- Data Collection Method:
- Online Surveys: Utilize online survey platforms for cost-effectiveness, convenience, and wider reach. Ensure compatibility across devices and browsers for accessibility.
- Telephone Surveys: Conduct telephone surveys for populations with limited internet access or when a more personal approach is preferred.
- Face-to-Face Interviews: Employ face-to-face interviews for complex surveys or with populations where visual aids or clarification may be necessary.
- Data Analysis Plan:
- Statistical Techniques: Determine appropriate statistical techniques for analyzing survey data based on the research objectives and types of variables involved (e.g., descriptive statistics, inferential statistics).
- Data Cleaning: Thoroughly clean and validate survey data to identify and rectify errors or inconsistencies before analysis.
- Interpretation: Interpret survey findings within the context of the research objectives and limitations, considering factors such as sampling error and response bias.
- Ethical Considerations:
- Informed Consent: Obtain informed consent from survey participants, providing clear information about the purpose of the survey, voluntary participation, and confidentiality measures.
- Confidentiality and Anonymity: Ensure confidentiality and anonymity of responses to encourage honest feedback and protect participant privacy.
- Compliance: Adhere to ethical guidelines and regulations governing research involving human subjects, such as those outlined by institutional review boards (IRBs).
By adhering to these best practices, researchers can design and implement quantitative surveys effectively, yielding reliable data for informed decision-making and research outcomes.
Summary: The Power of Quantitative Data
Quantitative data serves as a cornerstone for evidence-based decision-making across various domains. Derived from structured sources such as surveys and CRM systems, it offers numerical insights crucial for tracking trends and supporting informed decisions. However, while Excel suffices for basic analysis, its limitations become apparent with increasing data complexity. General quantitative analysis may fall short of capturing the full spectrum of insights organizations require. Additional methodologies like causation studies and text analysis are often necessary for comprehensive insights.
Enter Sopact Sense—a robust solution automating diverse analytical processes, saving hundreds of hours, and empowering organizations to make data-driven decisions efficiently. With a streamlined approach to both standard and advanced analyses, Sopact Sense revolutionizes decision-making.
Conclusion:
Let's dive straight into the heart of it: When an organization kicks things off with a crystal-clear learning objective, the game changes. Imagine saving more than 80% of your time by leveraging patterns and feedback analytics, like what Sopact Sense offers. It's not just about speed; it's about digging deeper and uncovering those rich insights that can propel your scaling process to new heights.
And guess what?We're only scratching the surface with quantitative insights. There's a whole world of thrilling, actionable insight patterns we're eager to explore with you. So, stay tuned because we're just getting started on this exciting journey together.